Alerts
 Allows you to view and manage the different Alerts associated with your device. You can access details about the specific alerts.
When any approved rules get triggered it is displayed on alerts... For example for device xyz if temp is greater than 50 send email and activate action ttt. If this rule is triggered then you can see an alert for this in Alerts with other details.
By the following hierarchy you can organize and manage your devices based in their respective alerts.
Alert Summary
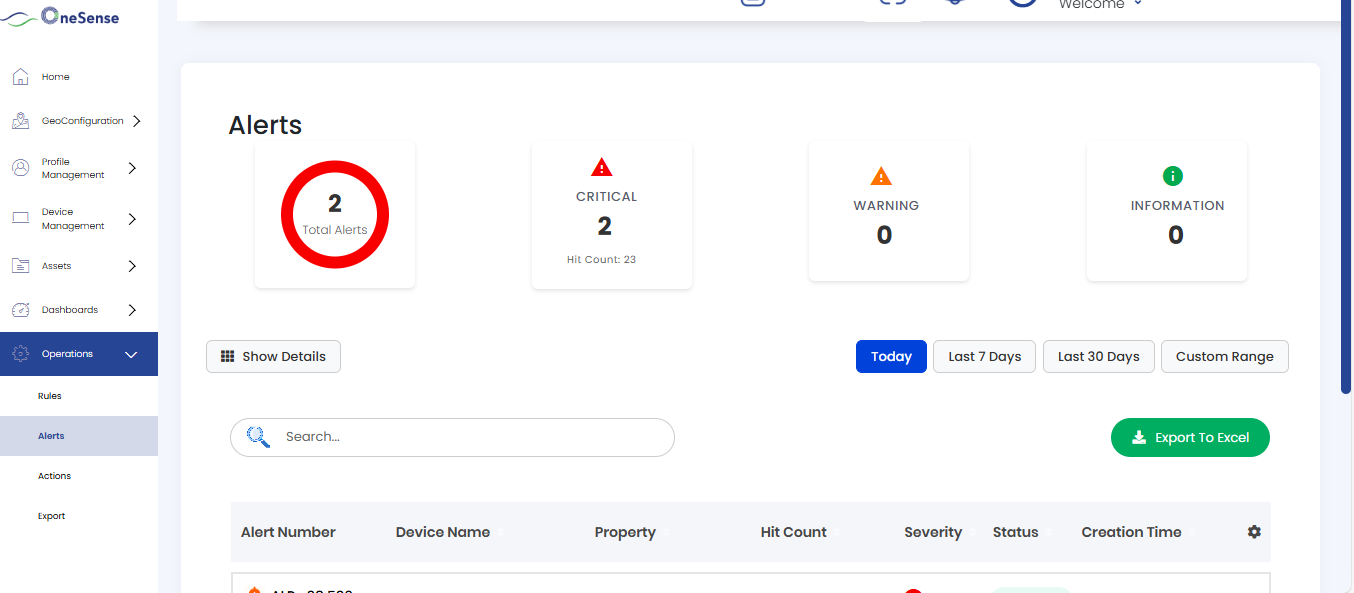
A donut chart visually represents the distribution of alerts by severity within the selected date range.
Critcal card shows the number of critical-severity alerts detected and hit count within the selected date range.
Warning card displays the count of warning-level alerts and hit count in the selected date range.
Information card shows the number of informational alerts and hit count within the selected date range.
Date Range Selection
Filter alerts by selecting a time period using the date range buttons:
- Today (Default selection)
- Last 7 Days
- Last 30 Days
- Custom Range
Show Details / Hide Details Toggle
Click the "Show Details" button to expand and view the Alert's Details heatmap visualization.
Click the "Hide Details" button to collapse the heatmap and return to the summary view.
Alert's Details Heatmap
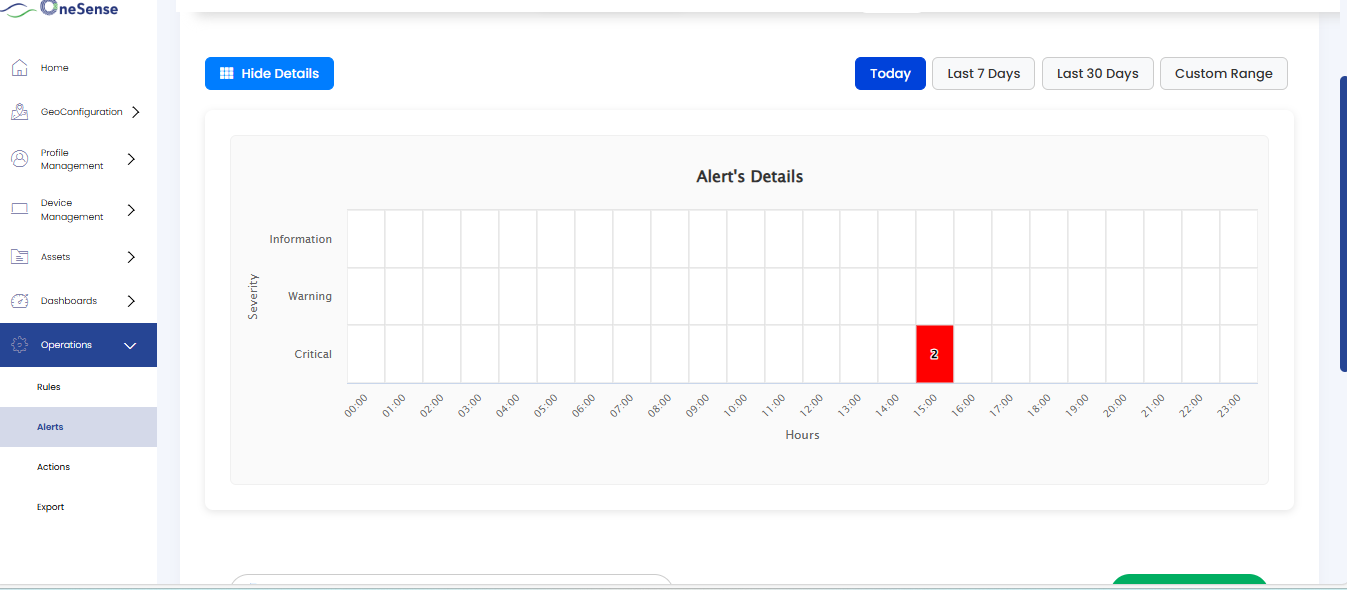
When details are shown, a heatmap visualization displays alert patterns over time:
- X-axis: Displays the timeline based on your selected date range
- Y-axis: Shows three severity levels - Information (Green), Warning (Orange), and Critical (Red)
Alert Details Table
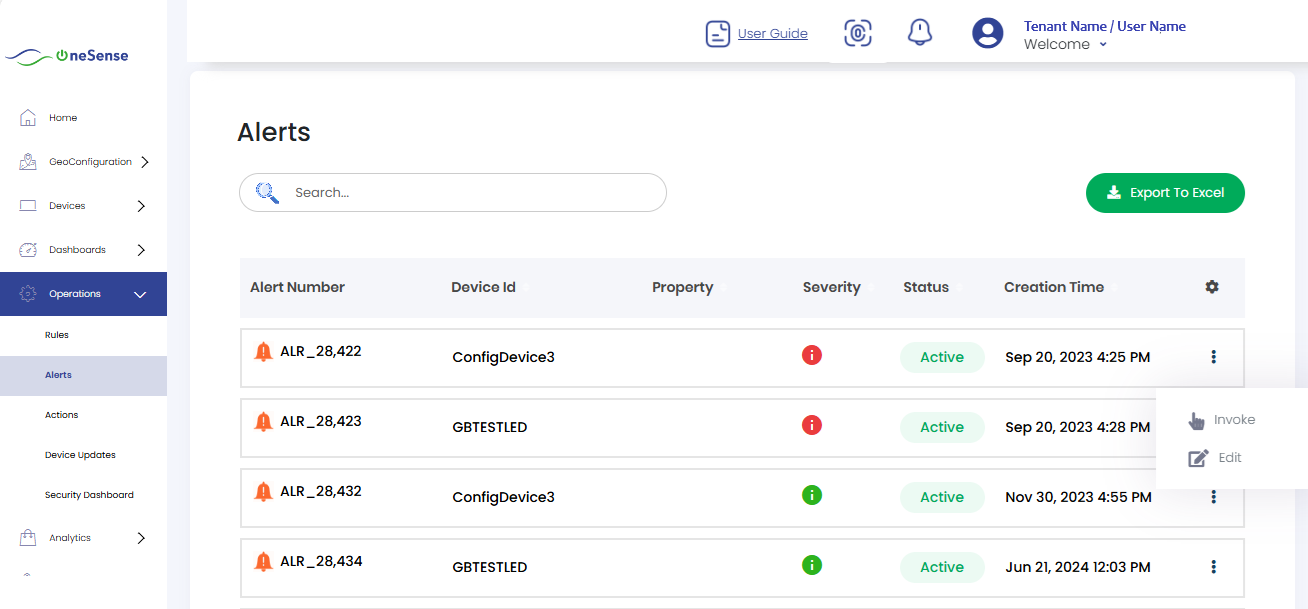
Here in the Alert section, you will find a list of all alerts in selected date range. Each alerts will have its corresponding name like Alert numbber, Device id, Property, Severity, status and its Creation time displayed for easy reference.
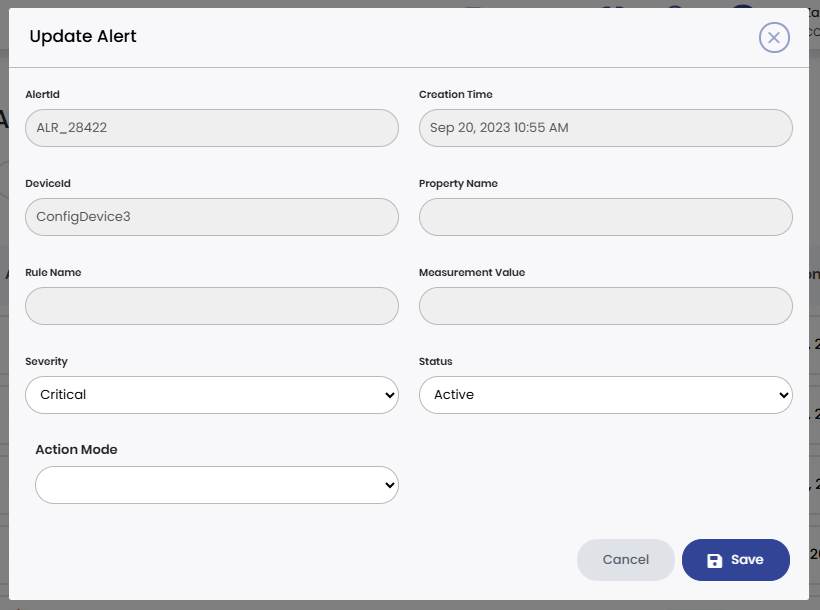
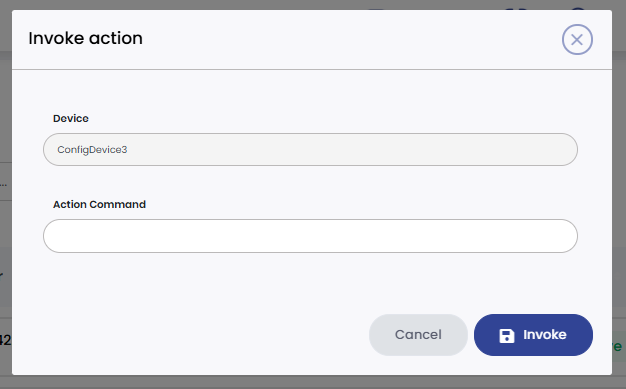
On the right side of the each alerts, there is a settings dropdown which provides Edit, and Invoke action.
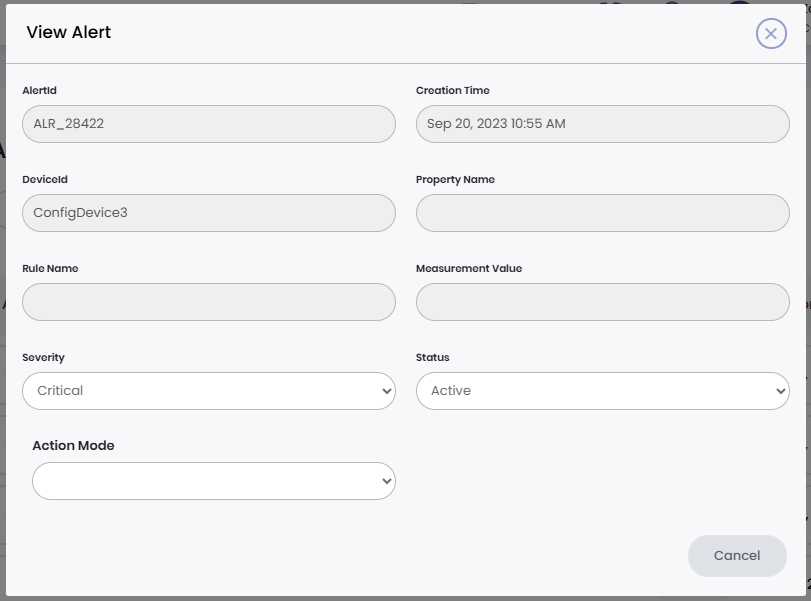
View