Dashboards
Creating a New Dashboard
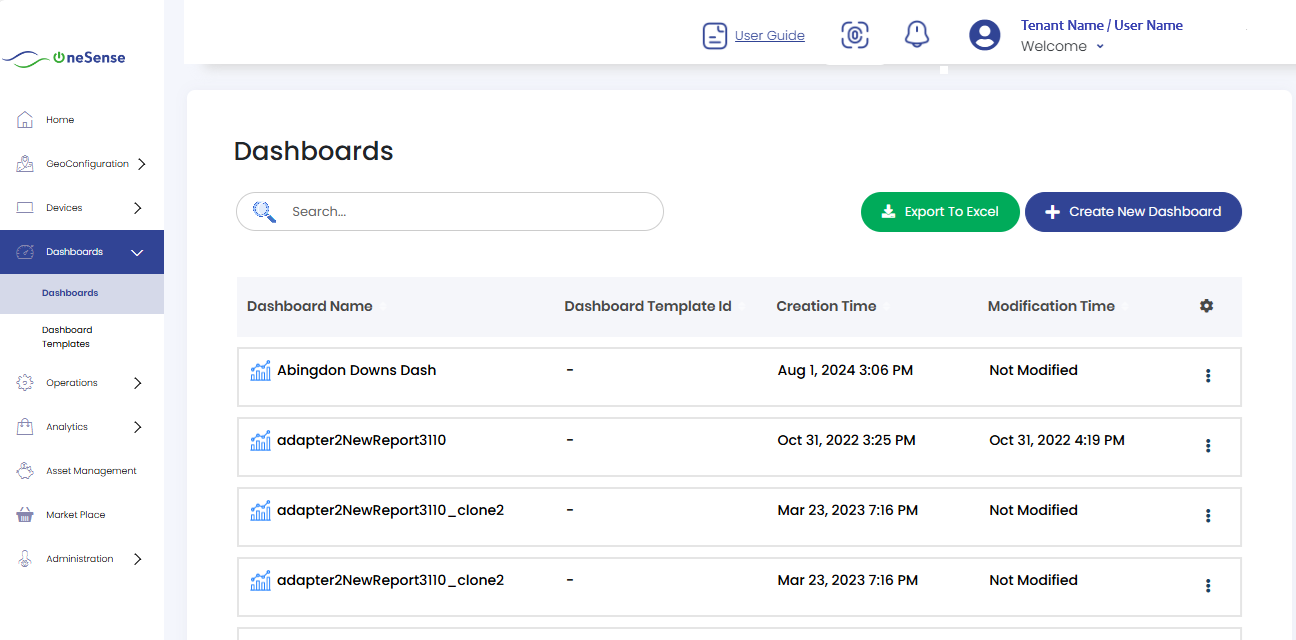
 Click on the **Create New Dashboard** button.
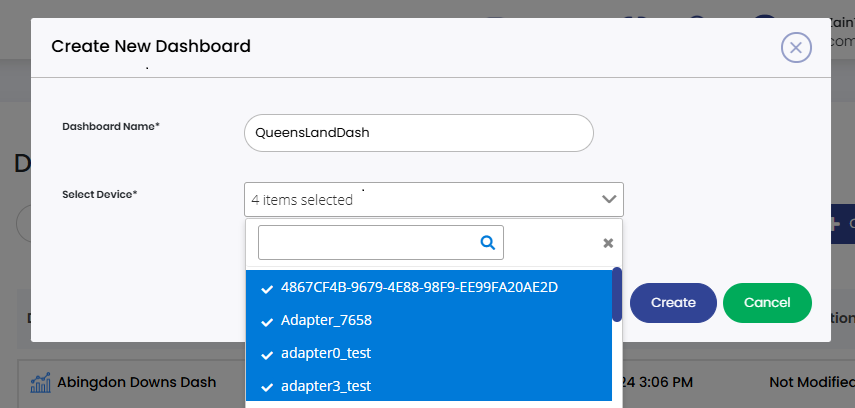
In the dashboard creation form, enter a descriptive **Dashboard Name** and select the devices you want to include from the provided list.
An optional dropdown will appear for selecting a **Dashboard Template**. If chosen, the new dashboard will be created based on that template.
Once ready, click on the **Create** button. You will be redirected to the **Edit Dashboard** page, where you can add, remove, resize, or customize features and charts. You can also go back without editing if you prefer.
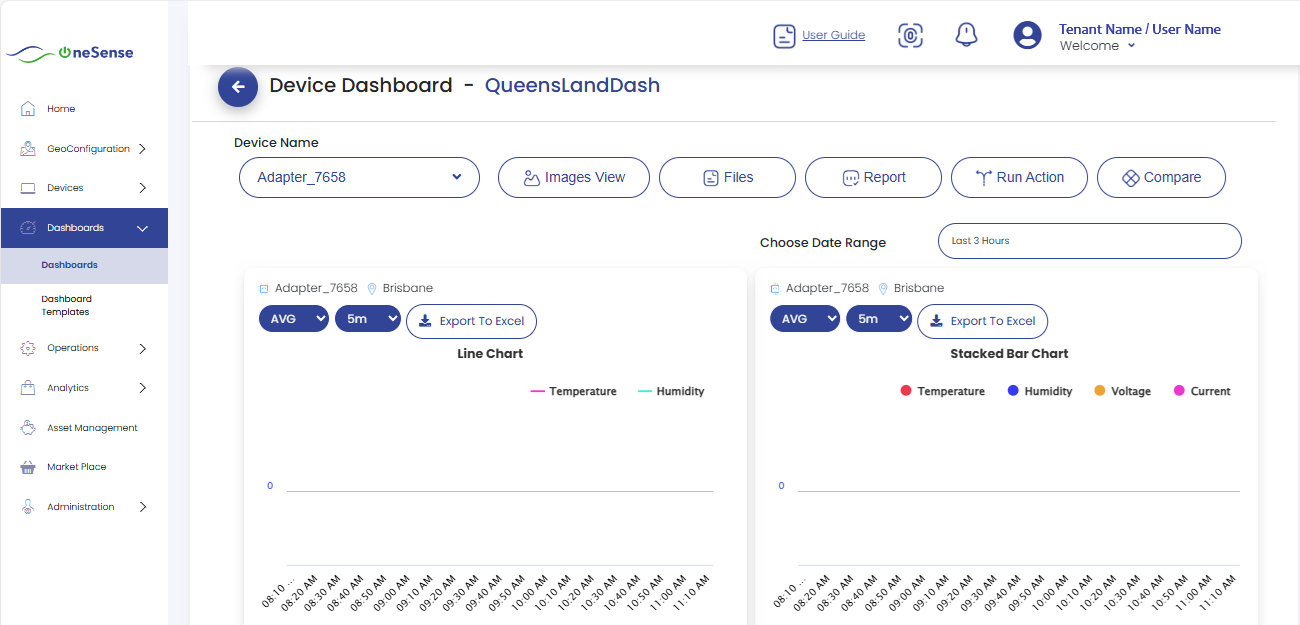
Charts & Features Setup in Dashboard
Similar to templates, dashboards allow you to add, resize, and configure the following charts and features:
- Bar Chart (with option for Stacked Bar Chart)
- Pie Chart
- Wind Rose Chart
- Area Chart (with option for Stacked Area Chart)
- Line Chart
- Telemetry
- Arg Value
- Location
- Image
- Text
- Equation
- Alerts
- Data Card
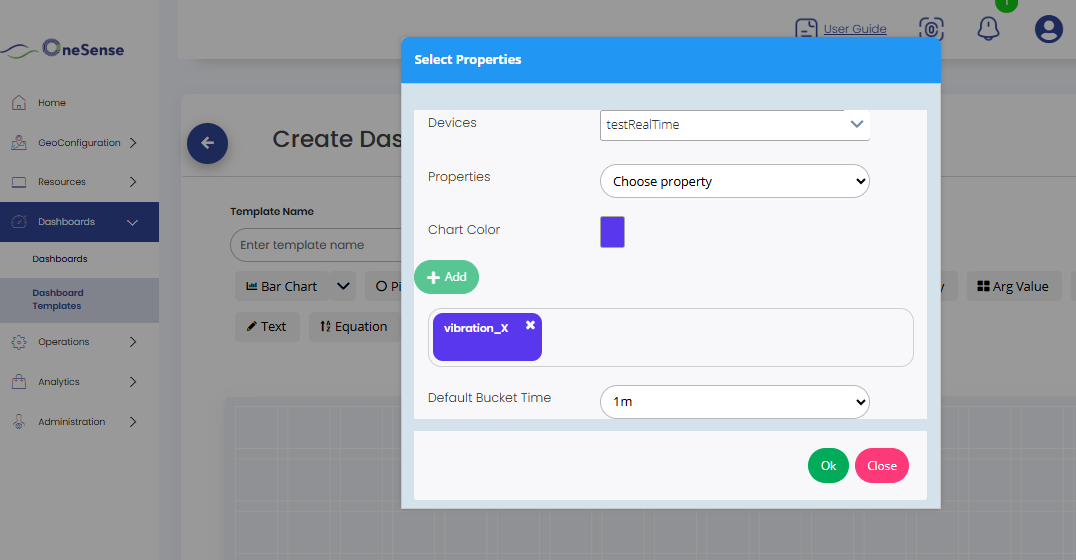
For Bar Chart, Pie Chart, Wind Rose Chart, Arg Value, Area Chart, and Line Chart:
Click the chart type you need.
A popup will appear asking for details.
Select the devices.
Add properties (temperature, humidity, etc.).
Steps:
- Select a property
- Choose a color
- Click Add
- Repeat for additional properties
Select the bucket time in minutes (e.g., 5m → aggregated values in 5-minute buckets).
You can change both the bucket time and the aggregation type (avg, min, max) later from the dashboard.
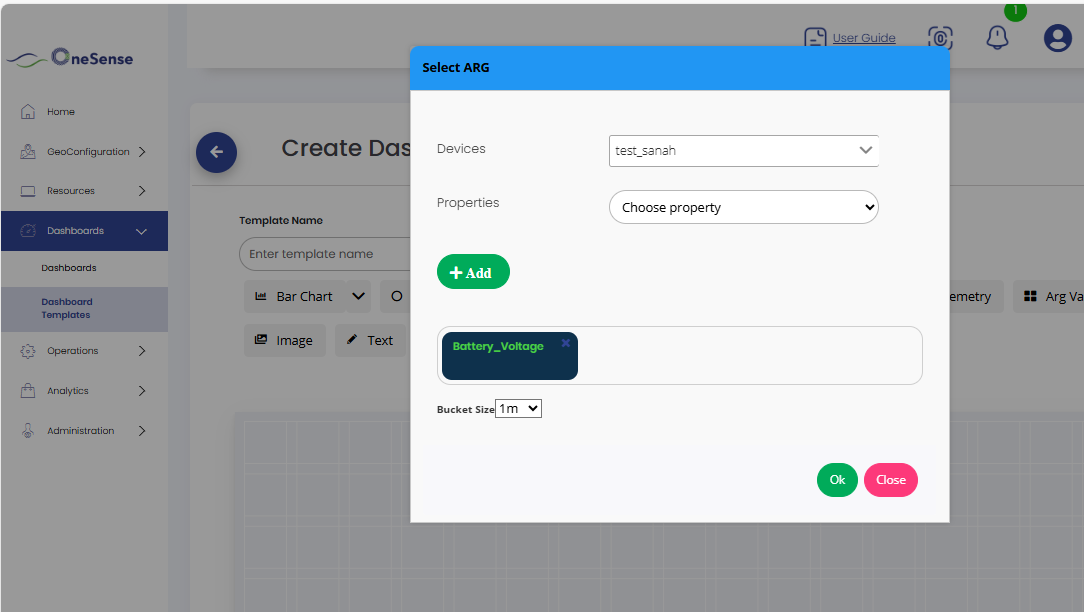
For Arg Value, filling details is shown below:
Other features work as follows:
Telemetry, Location, Image, Text, Alerts, Data Card → Directly show data once added.
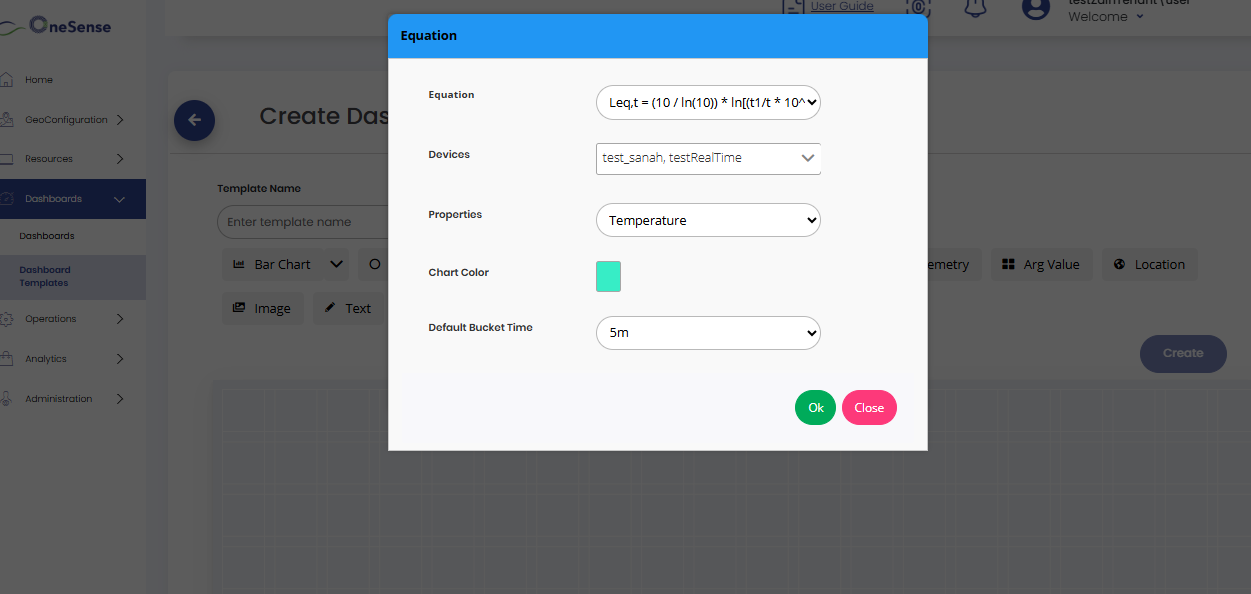
Equation → Requires setup:
- Click on the Equation feature.
- Select the equation you want.
- Choose a property (temperature, humidity, etc.).
- Pick a color.
- Select bucket time.
- Click OK.
Editing an Existing Dashboard
To edit a dashboard, click the settings dropdown on the right side of the respective Dashboard Name.
Select **Edit** from the dropdown. You can then add or remove devices, resize and move charts, or modify feature settings.
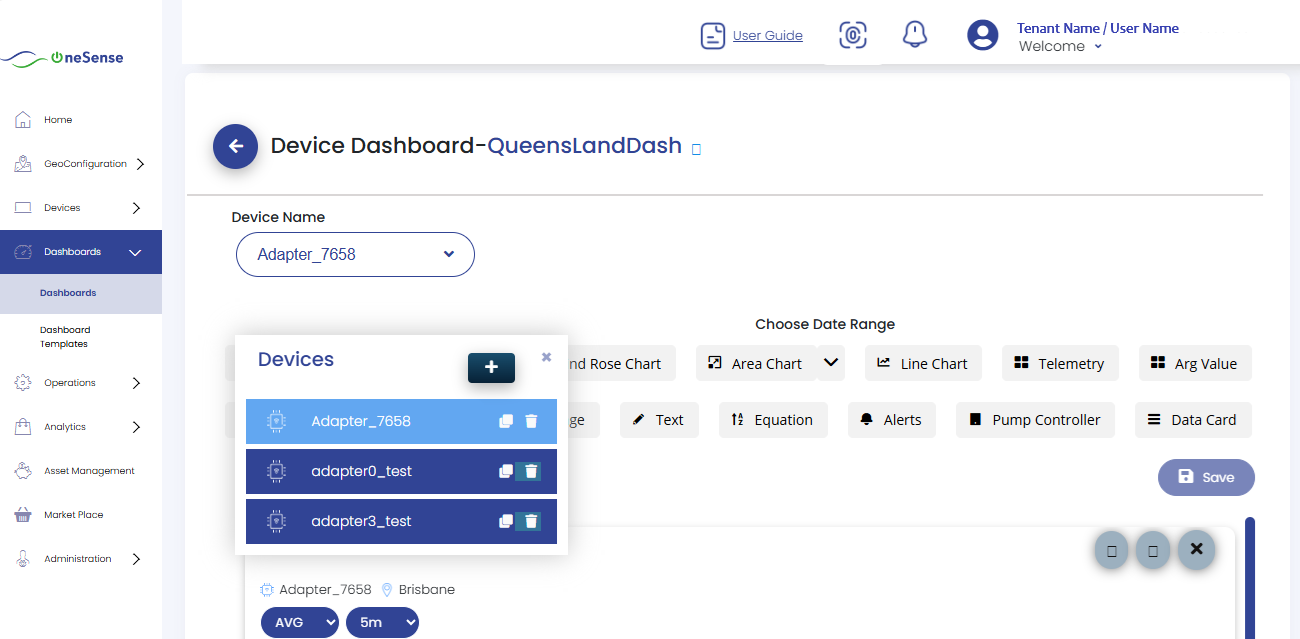
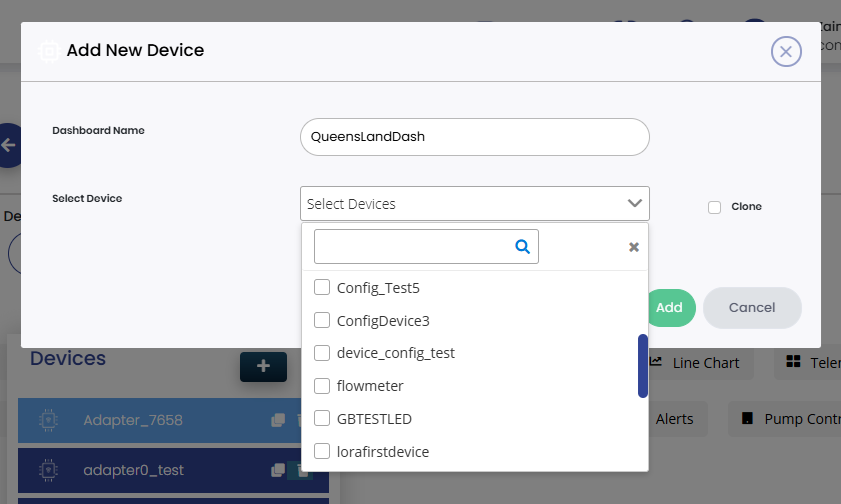
Click on the **+ button** to add devices to the dashboard. Enter the dashboard name (if needed) and select devices to include.
Click on **Save** to apply your changes.