Device Alert Dashboard
The Device Alert Dashboard provides a comprehensive overview of device alerts within the selected date range.
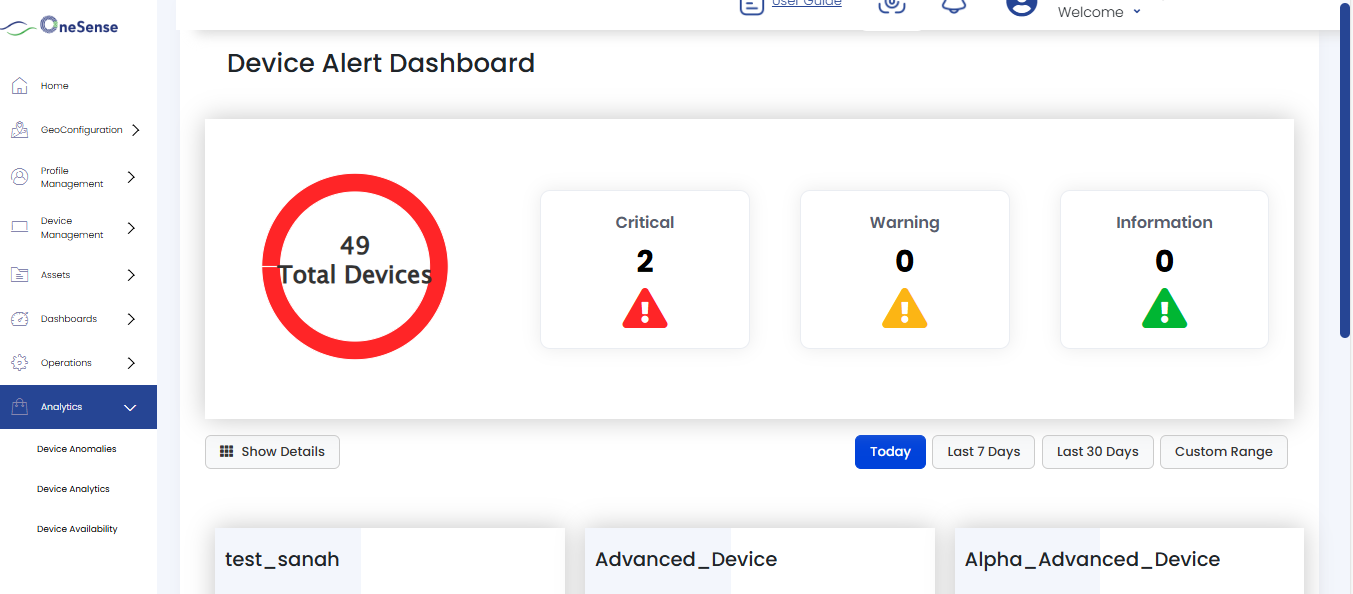

Total Devices (Donut Chart) displayed as a donut chart showing the total count of all devices. The donut chart visually represents the distribution of alerts by severity using color coding: red for Critical alerts, yellow for Warning alerts, and green for Information alerts.
Critical Alerts shows the number of critical-severity alerts detected within the selected date range. Critical alerts are displayed with a red warning icon.
Warning Alerts displays the count of warning-level alerts in the selected time period. Warning alerts are indicated by a yellow caution icon.
Information Alerts shows the number of informational alerts within the selected date range. These alerts are marked with a green information icon.
Date Range Selection
The dashboard includes date filter options:
- Today (Default selection)
- Last 7 Days
- Last 30 Days
- Custom Range
When a date range is selected:
- Alert counts (Critical, Warning, Information) update accordingly.
Device Alert Heatmap
The heatmap visualization can be toggled using the Show Details / Hide Details button. When expanded, it displays a comprehensive matrix view of alert distribution:
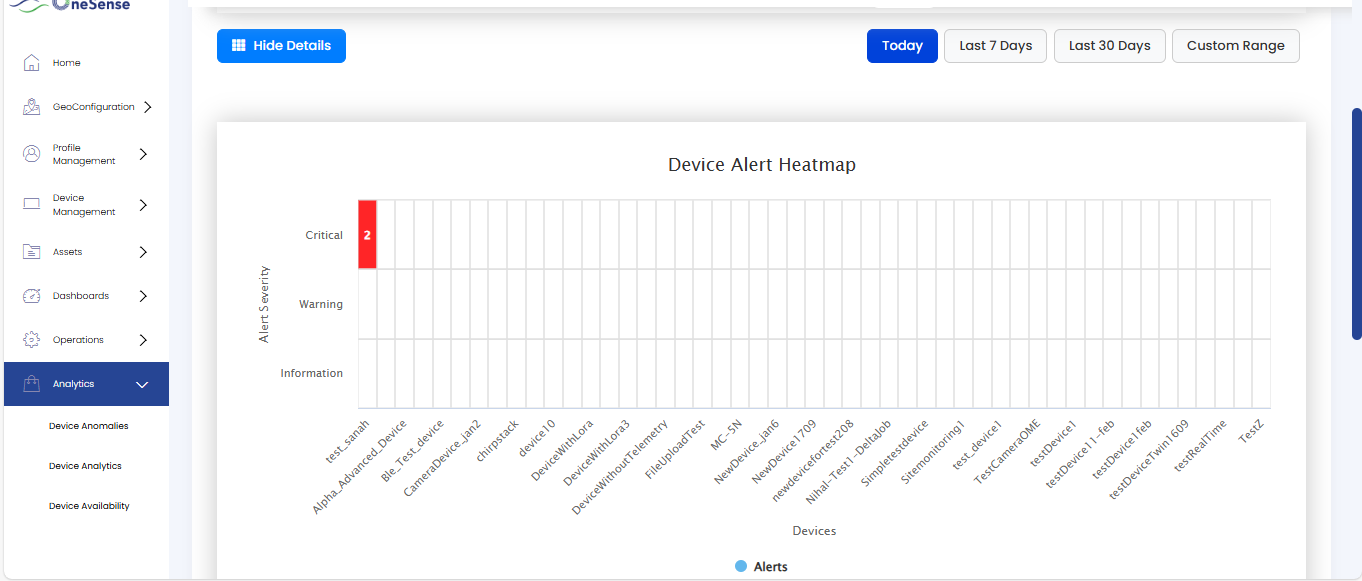
The heatmap organizes alerts by severity (Critical, Warning, Information) on the vertical axis and individual devices on the horizontal axis.
Device Alert Cards
Below the heatmap, the dashboard displays individual device cards that provide detailed alert information for each device.
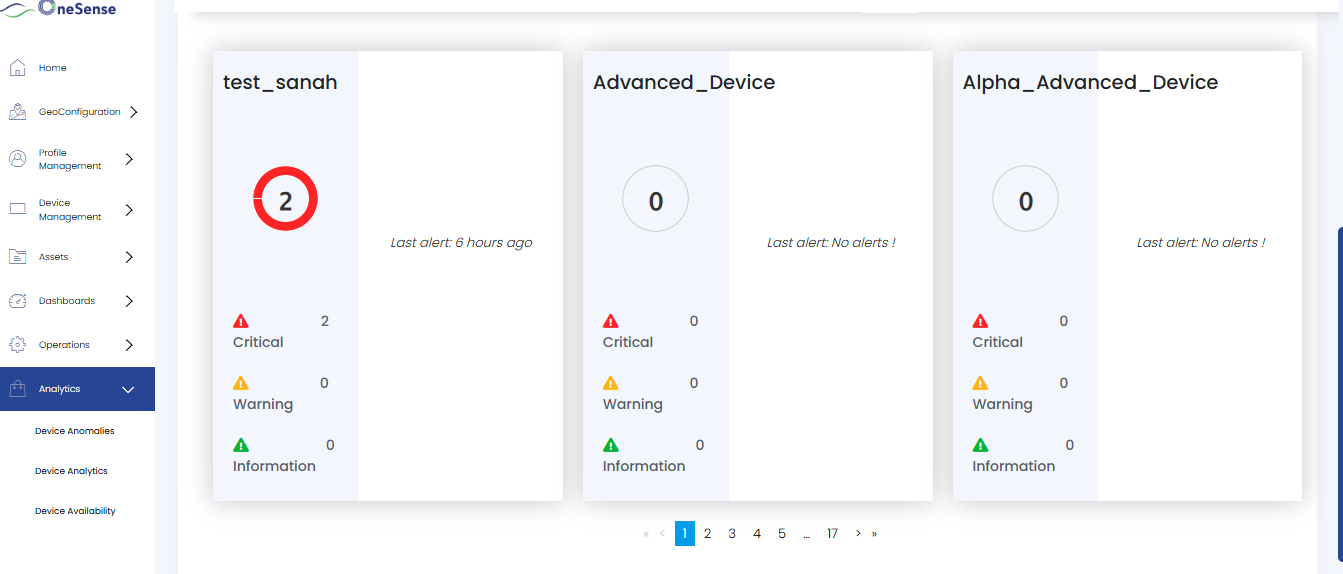
Device Name displays the name of the device.
Donut Chart the circular donut chart on each device card illustrates the distribution of alerts based on severity levels within the selected date range.
The numeric value displayed at the center of the donut chart represents the total alert count for that device.
Last Alert Timestamp displays when the most recent alert occurred.
Alert Breakdown by Severity each card shows a detailed breakdown of alerts categorized by severity level with corresponding icons and counts for Critical (red), Warning (yellow), and Information (green) alerts.